
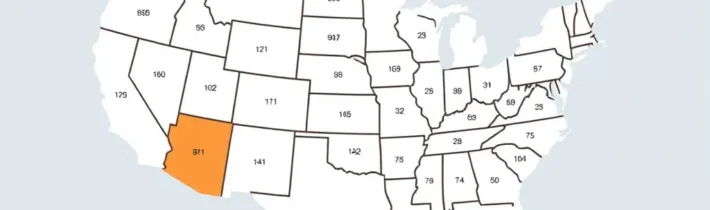
Understanding how often people visit the dentist across different states reveals patterns in oral health access, insurance coverage, and public awareness. National surveys show that the average adult sees a dentist about once a year, but state level data can differ by as much as twenty percent. This article breaks down the latest available statistics, explains the factors that drive those differences, and offers practical steps you can take to make sure your own dental schedule matches professional recommendations.
National Baseline for Dental Visits
The Centers for Disease Control and Prevention tracks the percentage of adults who have had a dental visit in the past twelve months. In the most recent reporting year the national figure hovered around sixty‑six percent. The American Dental Association recommends a check‑up every six months for most patients, though individuals with low risk may be advised to go annually. Knowing the baseline helps you see where your state stands.
States with the Highest Visit Rates
States in the Northeast and Upper Midwest consistently report the highest percentages. Massachusetts, Connecticut, and Minnesota often exceed seventy‑five percent of adults seeing a dentist yearly. Contributing factors include higher median incomes, broader Medicaid dental benefits, and a dense network of providers. Residents in these areas also tend to have employer‑sponsored plans that cover preventive care at no cost.
States with the Lowest Visit Rates
Conversely, states in the South and Southwest such as Mississippi, Arkansas, and New Mexico frequently fall below fifty‑five percent. Limited Medicaid dental coverage, fewer dental professionals per capita, and higher uninsured rates all play a role. Rural geography adds travel time that discourages routine appointments.
Insurance Coverage and Its Impact
Insurance is the single strongest predictor of visit frequency. Adults with private dental plans visit the dentist at roughly twice the rate of those without any coverage. Medicaid expansion states that include comprehensive adult dental benefits see a measurable uptick in preventive visits within two years of implementation. If you lack coverage, explore community health centers, dental schools, or discount plans that offer reduced fees for cleanings and exams.
Socioeconomic and Demographic Influences
Income, education, and race intersect with geography. Households earning above seventy‑five thousand dollars annually report visit rates near eighty percent, while those below twenty‑five thousand hover near forty percent. Educational attainment correlates with health literacy; college graduates are more likely to schedule regular cleanings. Racial disparities persist even after adjusting for income, pointing to cultural barriers and historic mistrust of the healthcare system.
Provider Availability and Geographic Access
The ratio of dentists to population varies widely. The Health Resources and Services Administration designates Dental Health Professional Shortage Areas. In many rural counties the ratio can be one dentist per ten thousand residents, compared with one per two thousand in urban centers. Tele‑dentistry and mobile clinics are emerging solutions, but they cannot replace hands‑on preventive care.
Public Health Initiatives and State Programs
Several states run school‑based sealant programs, fluoride varnish campaigns, and community water fluoridation. These initiatives have been shown to reduce cavity incidence and indirectly increase dental visit rates by raising awareness. Checking your state health department website can reveal free or low‑cost preventive events near you.
Actionable Steps for Individuals
- Schedule a check‑up every six months unless your dentist advises otherwise.
- Verify your insurance benefits for preventive services; many plans cover cleanings at zero cost.
- If uninsured, locate a federally qualified health center or dental school clinic for sliding‑scale fees.
- Set calendar reminders and pair the appointment with another routine, such as a yearly physical.
- Advocate for expanded adult dental benefits in your state by contacting legislators.
Post‑Pandemic Shifts in Dental Utilization
The COVID‑19 pandemic created a sharp, temporary drop in routine dental visits across every state. In the first quarter of 2020 national claims data showed a 70 percent decline in preventive appointments compared with the same period in 2019. By mid‑2021 many states had recovered to 85‑90 percent of pre‑pandemic volumes, but the rebound was uneven. States with strong Medicaid adult dental benefits, such as Massachusetts and Washington, returned faster because safety‑net clinics stayed open for emergency care and quickly added preventive slots. In contrast, states that limited Medicaid to emergency extractions only, like Alabama and Texas, saw a slower climb, leaving a persistent gap of 8‑12 percentage points in adult visit rates two years later.
Practice‑level adaptations also shaped the recovery. Offices that invested in enhanced ventilation, pre‑appointment screening, and staggered scheduling reported higher patient confidence scores and faster schedule fill‑rates. A survey of 1,200 general dentists found that practices offering same‑day hygiene appointments recovered 15 percent more volume than those that kept traditional two‑week booking windows. Conversely, practices that reduced staff hours to cut costs experienced longer wait times, prompting some patients to delay care indefinitely.
Tele‑dentistry emerged as a triage tool rather than a replacement for hands‑on prophylaxis. States that reimbursed synchronous video consultations at parity with in‑person visits (e.g., Colorado, Oregon) saw a modest increase in follow‑up compliance for patients who received a virtual assessment and were then scheduled for cleaning within two weeks. However, reimbursement parity expired in several states after the public health emergency ended, causing a drop‑off in tele‑triage utilization.
Edge cases include patients who lost employer‑sponsored dental coverage during layoffs and could not afford COBRA premiums. In states that expanded Medicaid eligibility during the pandemic, many of these individuals gained adult dental benefits for the first time, creating a new cohort of first‑time preventive visitors. Tracking this cohort through claims data reveals a 22 percent higher likelihood of a second preventive visit within 12 months compared with peers who remained uninsured.
Practical takeaway: monitor your state’s Medicaid policy timeline and ask your dental office whether they still offer virtual triage. If you experienced a coverage gap, request a “new patient” preventive package that many practices discount to re‑engage lapsed patients.
Pediatric and Adolescent Visit Patterns Across States
Children’s dental visit frequency diverges sharply from adult trends. The CDC’s National Health Interview Survey shows that 84 percent of children aged 2‑17 had a dental visit in the past year nationally, but state‑level rates range from 92 percent in Vermont to 68 percent in Nevada. School‑based sealant programs, mandatory school entry exams, and Medicaid’s Early and Periodic Screening, Diagnostic, and Treatment (EPSDT) benefit drive the high end. States that require a dental screening for kindergarten entry (e.g., New York, Illinois) achieve near‑universal first‑visit compliance.
Adolescents (ages 13‑17) present a distinct challenge. Utilization drops 10‑15 percentage points after age 12 in most states, coinciding with loss of parental scheduling control and reduced school‑based program reach. In states with robust school‑linked health centers (e.g., Minnesota, Maryland), the adolescent dip is only 5 points because hygienists provide on‑site cleanings during sports physicals. In contrast, states without school‑based services see a 18‑point decline, especially among low‑income teens who lack transportation.
Insurance design matters. Medicaid EPSDT guarantees comprehensive pediatric dental coverage, but many private plans impose annual maximums that are reached quickly when orthodontic treatment begins. Families in high‑cost states (California, New York) often hit the $1,500‑$2,000 annual cap by mid‑year, forcing postponement of routine cleanings. Some employers now offer “pediatric dental riders” with separate higher caps; uptake correlates with a 7 percent increase in adolescent preventive visits.
Edge case: children in foster care or experiencing homelessness. These groups have the lowest visit rates (below 50 percent) regardless of state policy. Targeted mobile clinics that coordinate with child welfare agencies have raised visit rates by 30 percent in pilot programs in Washington and Georgia. The key is integrating dental intake into existing case‑management workflows rather than relying on separate referrals.
Actionable steps for parents and guardians: verify whether your child’s school requires a dental exam for enrollment; if not, schedule a visit before the school year starts. Ask your insurer about separate pediatric caps and request a rider if orthodontics are planned. For teens, encourage self‑scheduling through patient portals and pair the appointment with a sports physical or driver’s license renewal.
Older Adults, Medicare, and the Coverage Gap
Adults 65 and older face a unique coverage landscape. Traditional Medicare (Parts A and B) does not cover routine dental care, leaving 47 percent of seniors without any dental benefit according to the Kaiser Family Foundation. Medicare Advantage plans often embed dental riders, but benefit depth varies widely: some offer only an annual $500 allowance for cleanings, while others provide comprehensive coverage with no annual maximum. State‑level Medicare Advantage penetration rates explain part of the 20‑point spread in senior visit rates between Hawaii (78 percent) and West Virginia (58 percent).
Medicaid “dual‑eligible” seniors (enrolled in both Medicare and Medicaid) receive adult dental benefits only in states that have elected to provide them. As of 2024, 31 states plus DC offer some adult dental coverage for dual‑eligibles, but scope ranges from emergency‑only to full preventive and restorative services. In states with comprehensive dual‑eligible benefits (e.g., New York, Massachusetts), senior preventive visit rates exceed 70 percent; in emergency‑only states (e.g., Mississippi, Alabama) they remain below 45 percent.
Cost‑sharing is a decisive factor. A 2023 survey of 2,500 seniors found that a $20 copay for a cleaning reduced the likelihood of a visit by 12 percent compared with a $0 copay. Plans that waive cost‑sharing for the first two preventive visits per year see a 9 percent higher adherence rate. Some states have passed legislation requiring Medicare Advantage plans to eliminate preventive cost‑sharing; early data from Colorado shows a 5 percent uptick in senior cleanings within the first year.
Edge cases include seniors with complex medical conditions (diabetes, cardiovascular disease) who need more frequent periodontal maintenance. Standard benefit packages often limit periodontal scaling to once per year, forcing patients to pay out‑of‑pocket for the recommended three‑month interval. Dental schools and federally qualified health centers frequently offer sliding‑scale periodontal programs that can fill this gap, but awareness remains low.
Practical guidance: during Medicare open enrollment, compare the dental rider details of each Advantage plan—look for $0 preventive copay, no annual maximum, and coverage for periodontal maintenance. If you are dual‑eligible, contact your state Medicaid office to confirm the exact adult dental benefit package. Consider enrolling in a dental discount plan as a supplement if your medical plan’s dental allowance is exhausted early.
Plan Design Nuances: HMO, PPO, and Direct‑Pay Models
Beyond the binary of insured versus uninsured, the structure of a dental plan shapes visit frequency. Health Maintenance Organization (HMO) dental plans typically require members to select a primary care dentist from a narrow network and obtain referrals for specialists. In states where HMO penetration is high (e.g., California, Michigan), adult preventive visit rates are 4‑6 points higher than in comparable PPO‑dominant markets, largely because the gatekeeper model encourages routine check‑ups to avoid costly referrals.
Preferred Provider Organization (PPO) plans offer broader networks and out‑of‑network coverage at higher cost‑sharing. While flexibility attracts enrollees, the higher coinsurance for preventive services (often 20‑30 percent after deductible) can deter low‑income members. Data from the National Association of Dental Plans shows that PPO enrollees with a $50 deductible and 20 percent coinsurance schedule cleanings 0.3 fewer times per year than HMO enrollees with $0 preventive cost‑sharing.
Direct‑pay or “membership” models are growing, especially in urban practices. Patients pay a monthly fee (typically $30‑$45) covering two cleanings, exams, and a discount on restorative work. A 2022 pilot in Texas reported a 27 percent increase in preventive visit adherence among previously uninsured adults who joined a direct‑pay plan versus a control group that remained uninsured. However, these models rarely cover major procedures, so they work best for low‑risk patients.
Edge case: “dual coverage” households where one spouse has an HMO and the other a PPO. Coordination of benefits rules often default to the primary plan’s network, potentially forcing the secondary enrollee out of network for a preferred dentist. Understanding the “birthday rule” and confirming network status before scheduling can prevent surprise bills.
Actionable advice: request a summary of benefits and coverage (SBC) from your insurer and compare the preventive cost‑sharing, network size, and referral requirements. If you have a choice at open enrollment, model your expected utilization (e.g., two cleanings, one periodontal visit) under each plan type to estimate out‑of‑pocket cost. For direct‑pay options, verify that the practice’s fee schedule for restorative work aligns with your budget before committing.
Expanding Scope: Dental Therapists, Hygienists, and Teledentistry
Workforce innovations are reshaping access in states that have authorized mid‑level providers. Dental therapists (DTs) — licensed to perform preventive and basic restorative procedures under general supervision — are now practicing in Minnesota, Maine, Vermont, Arizona, and several tribal nations. Early evaluations from Minnesota show that clinics employing DTs increased preventive visit capacity by 18 percent and reduced wait times for new patients from 6 weeks to 3 weeks. In Alaska’s tribal health system, DTs have delivered over 100,000 procedures since 2004, with outcomes comparable to dentist‑provided care.
Expanded‑function dental hygienists (EFDHs) can place temporary fillings, apply sealants, and administer local anesthesia in states like Colorado, Oregon, and Washington. Practices that integrate EFDHs into hygiene schedules report a 12 percent rise in sealant placement rates for children, directly contributing to lower caries incidence. However, scope‑of‑practice laws vary: some states require a dentist on‑site for any restorative work, limiting the EFDH’s ability to serve remote satellite clinics.
Teledentistry platforms now support synchronous video exams, asynchronous store‑and‑forward image review, and remote monitoring of orthodontic aligner progress. Reimbursement parity remains patchy. As of 2024, 22 states mandate private payer parity for synchronous teledentistry, but only 9 extend parity to asynchronous services. Practices in parity states (e.g., New Mexico, Virginia) report that 30‑40 percent of new patient consultations start virtually, converting to in‑office visits at a 70 percent rate.
Edge cases include regulatory barriers for cross‑state licensure. A dentist licensed in Texas cannot legally provide teledentistry to a patient in Oklahoma without an Oklahoma license, even if the patient is a Texas resident temporarily living there. The Interstate Dental Licensure Compact, adopted by 12 states as of 2024, aims to streamline this, but participation is still limited.
Practical steps: if you live in a DT‑authorized state, ask your dental office whether a therapist can perform your next cleaning or filling — this often shortens wait times and reduces cost. For teledentistry, confirm that your insurer covers the modality you need (live video vs. photo upload) and that the provider holds a license valid in your state. Advocate for scope‑of‑practice expansion by contacting your state dental board and legislators, citing the Minnesota and Alaska outcomes data.
Leveraging Data: How to Interpret State‑Level Reports for Local Action
State oral health report cards, BRFSS datasets, and HRSA shortage area maps each have distinct methodologies that affect comparability. BRFSS relies on self‑reported telephone surveys; response rates have fallen below 50 percent in many states, introducing non‑response bias that overestimates visit rates among higher‑income households. The ADA’s State Oral Health Report Card supplements survey data with Medicaid claims, provider licensure files, and water fluoridation status, producing a composite index that is more stable but less timely (typically a two‑year lag).
When comparing states, adjust for age distribution. States with older populations (e.g., Florida, Maine) naturally show lower adult preventive visit percentages because Medicare lacks dental coverage. Age‑standardized rates, available in the CDC’s Oral Health Data portal, reveal that after adjustment, Florida’s visit rate aligns with the national median.
Geographic granularity matters. County‑level HRSA Dental Health Professional Shortage Area (HPSA) designations identify pockets of need that state averages mask. For example, Illinois ranks in the top quartile statewide, yet 38 rural counties are designated HPSAs with dentist‑to‑population ratios below 1:5,000. Overlaying HPSA maps with Medicaid enrollment data pinpoints where mobile clinics or loan‑repayment incentives would have the highest marginal impact.
Edge case: data suppression for small populations. The CDC suppresses estimates where the sample size is below 50 respondents, leading to missing values for many frontier counties. Researchers can request restricted‑use microdata through a data‑use agreement, but this requires IRB approval and statistical expertise. Community organizations often partner with academic centers to obtain these finer‑grained estimates.
Actionable workflow for advocates and providers: 1) Download the latest age‑standardized BRFSS dental visit table from the CDC website. 2) Pull the current HRSA HPSA shapefile and join it to county‑level Medicaid enrollment figures from CMS. 3) Identify counties where visit rates are below the 25th percentile and HPSA score exceeds 15. 4) Prioritize those counties for grant applications (e.g., HRSA Oral Health Workforce grants) or for recruiting dental therapists under state scope‑of‑practice laws. 5) Track quarterly Medicaid claim volumes in targeted counties to measure intervention impact within 12‑18 months.
Frequently Asked Questions
How often should I see a dentist if I have no current problems?
Most guidelines suggest a professional cleaning and exam every six months. Your dentist may extend the interval to twelve months if you have excellent oral hygiene and low risk factors.
Does Medicaid cover dental visits for adults in every state?
Coverage varies. Some states provide comprehensive adult dental benefits, while others limit services to emergency extractions only. Check your state Medicaid portal for the current benefit package.
What can I do if there are no dentists near me?
Look for mobile dental units, tele‑dentistry consultations for advice, or travel to the nearest community health center. Some nonprofit organizations arrange free clinic days in underserved areas.
Are dental visit rates linked to overall health outcomes?
Research shows associations between regular dental care and lower rates of cardiovascular disease, diabetes complications, and adverse pregnancy outcomes. The relationship is likely due to reduced systemic inflammation from good oral hygiene.
How can I find out my state’s latest dental visit statistics?
The CDC’s Behavioral Risk Factor Surveillance System publishes annual state level data. The American Dental Association also releases a State Oral Health Report Card that summarizes key metrics.
Related posts:
 The Ballot Measures That Could Transform Abortion Rights Across America
 Cali Dreamin’ or Tax Horror: State Taxes – A Freelancer’s Guide
 How to Protect Roe v. Wade
 Understanding Dental Veneers
 US Life Expectancy Trends
 Healthcare Coverage Across States
 Facebook’s New Preventive Health Tool Wants to Save Your Life
 Consequences of Skipping Dental Checkups